
The Inventory Trap: Why Silver's Crash Failed to Resolve the March Crisis
The Silver Squeeze Isn't Over: How to Position for March's Binary Delivery Outcome and the Two-Tier Market That Follows.

For Free Subscribers:
Thank you for reading. I keep this analysis open to all subscribers because clarity matters more than gatekeeping. Transparency builds trust. If you want to understand more, you can read yesterday’s article.
Introduction
The January 30 silver crash was a tactical victory disguised as a strategic resolution. The 33% single-day collapse from approximately $121 to $81 (with intraday lows touching the mid-$70s) appeared to purge speculative excess and relieve delivery pressure. But the underlying math tells a different story. COMEX inventory data, February flows, and March’s structural geometry reveal that the crash addressed symptoms, not causes, and potentially accelerated the very crisis it was meant to prevent.
The Illusion: Why Most Analysis Misses the Signal
Mainstream commentary frames the January flash crash as systemic catharsis: overleveraged specs forced to liquidate, margin calls purging weak hands, volatility normalizing into equilibrium. This narrative is mechanically accurate for a single trading session. It is strategically misleading for understanding what comes next.
The critical question is not whether the crash happened, but whether it changed any of the structural parameters that generated the crash. Consider the evidence:
Parameter One: COMEX Registered Inventory
As of early February 2026, reported COMEX registered silver inventory stands at approximately 103-113 million ounces according to exchange warehouse reports. Total COMEX inventory (registered plus eligible) is approximately 403-411 million ounces. The variance between headline numbers and effective deliverable inventory is significant.
Think of this distinction clearly: registered silver in COMEX vaults includes metal that is technically deliverable but may already be allocated, pledged, or subject to competing claims. When delivery notices arrive, custodians must distinguish between inventory they control outright and inventory they control subject to someone else’s rights.
In January 2026, which is not a major delivery month, COMEX processed delivery demand totaling between 33-40 million ounces through the first two weeks (26% of the registered inventory), with estimates reaching as high as 40-49 million ounces for the full month. Compare this to historical precedent:
January 2025 and prior years: Typically 1-5 million ounces
December 2025 (major month): 46.635 million ounces delivered, representing 50% of the estimated free-float
The January 2026 figure represents a 7-10x increase over historical January averages. This is not profit-taking. This is front-running. Market participants accelerated their delivery requests before March arrived, which means they expected both opportunity and risk. They secured physical metal before the inventory shrank further.
Parameter Two: The Outflow Accelerant
Simultaneous with January’s delivery surge, COMEX silver flowed to London at an extraordinary pace. During the first week of January alone, COMEX registered inventory declined by 18 million ounces while deliveries totaled 33.45 million ounces—meaning the balance was sourced from already-allocated inventory or eligible stock conversions.
Why London? Because London lease rates spiked to 34.9% on October 9, 2025, with intraday peaks reaching 39.2% according to Japan Bullion Market Association data. By late October, lease rates had declined to approximately 5.6% but remained elevated relative to normal sub-1% levels. High lease rates signal physical scarcity. They create arbitrage. Traders source silver from New York and transport it to London, where dealer vaults are depleted. The rate differential covers transport and financing costs while leaving a spread.
This is not a new demand. This is an existing paper demand being redirected through geography. But the mechanism reveals the underlying structure: when one market tightens, paper positions migrate to source physical metal from another market. The total amount of deliverable silver doesn’t increase. It redistributes. And redistribution costs inventory time and movement capacity.
By early February, I observed that the January crash did not reverse this flow pattern. It interrupted it briefly, then fundamental arbitrage forces resumed.
Parameter Three: March’s Structural Mathematics
March is COMEX’s primary delivery month. Historical deliveries in major months typically range from 10-20+ million ounces, depending on market conditions. For reference, December 2025 saw 46.635 million ounces delivered, representing 50% of the estimated free-float registered inventory.
For March 2026, open interest in the March silver contract represents approximately 500 to 528 million ounces notional (around 100,000+ contracts at 5,000 oz per contract). This open interest includes both longs and shorts. If only 10-25% of participants stand for delivery—a conservative assumption during stress—March faces delivery requests of 70 to 90 million ounces.
The registered inventory available to meet these requests currently stands at approximately 103-113 million ounces officially. Some analysts estimate that effective unencumbered inventory—metal truly available without creating obligations that exceed custodians’ willing commitments—may be significantly lower.
The January crash didn’t move this needle. Open interest rolled forward, not downward. Longs who were underwater at the crash lows didn’t liquidate into oblivion. They held, waited for technicals to stabilize, and are now positioned to roll into later months or take delivery as the calendar approaches March.

The crash did accomplish one thing: it reduced leverage in the system temporarily. CME margin requirements increased from $22,000 to $32,500 per contract for maintenance margin by Jan 13, 2025, representing an approximately 47-48% increase implemented specifically to address extreme volatility. Highly leveraged specs capitulated. But the core positions—the structural long interest that believes in silver’s fundamental deficit—didn’t vanish. They endured.

Why the Crash Failed: The Core Logical Error
Conventional analysis assumes that a price crash relieves pressure by transferring value from bulls to bears, thereby restoring equilibrium. In a normal market, this works. High prices attract supply; price crashes purge weak demand; supply-demand rebalance.
Silver’s structure is broken.
Supply cannot increase within the timeframe that matters. Primary silver mines take 5-8 years to bring into production. Recycling rates depend on industrial demand, which is inelastic at the production margins. You cannot suddenly mine 50 million more ounces in the next 60 days.
Demand is bimodal: industrial (mostly inelastic) and investment/monetary (highly price-elastic in futures markets, inelastic in physical). The crash wiped out futures leveraged demand, but it didn’t eliminate industrial silver consumption in solar panels, electronics, electric vehicles, or data center cooling. That demand continues at levels that create a substantial structural market deficit.
The Silver Institute reported a 2024 deficit of 148.9 million ounces, marking the fourth consecutive year of deficits. The cumulative four-year deficit (2021-2024) totaled 678 million ounces—equivalent to ten months of global mine production in 2024. The 2024 figure was down from 2023’s 200.6 million ounce deficit, but the structural imbalance remains intact. Industrial demand reached a record 680.5 million ounces in 2024, driven primarily by electronics, electrical applications, and photovoltaic installations.
The crash also didn’t materially increase the incentive for holders to release inventory. Physical gold and silver holders with 5-10 year investment horizons don’t respond to crashes by selling. They hold through them. The January 30 crash triggered forced liquidations in leveraged paper positions, but it redirected rather than eliminated the underlying structural bid for physical metal.
Evidence: Following the crash, iShares’ SLV silver ETF saw significant institutional inflows. On a single day in early February, SLV recorded over 1,023 tonnes (approximately 32.9 million ounces) in inflows—the third-largest single-day inflow in the ETF’s history. This is not desperation selling. This is opportunistic buying. The bid wasn’t broken. It relocated lower.

The Unresolved Tension: Effective Inventory vs. Headline Inventory
The core analytical error underpinning assumptions about COMEX health revolves around inventory classification. The exchange reports registered silver inventory in the 103-113 million ounce range, depending on the date and measurement methodology. This number circulates widely.
But registered inventory includes silver that meets COMEX specifications yet may already be allocated to clients, subject to storage agreements, pledged as collateral for other positions, or held in vaults where the custodian (typically a bank) is also the beneficial owner and not obligated to release it.
Analysts who track warrant assignments and depository movements estimate that the amount of truly available unencumbered silver in COMEX vaults may be substantially lower than headline registered figures. Think of the distinction in household terms: A bank customer has $100,000 in the account (registered), but $50,000 is earmarked for a mortgage payment due next week, $20,000 is pledged as collateral for a home equity line of credit, and $15,000 is subject to a judgment lien. The available balance, while technically in the account, is operationally constrained to $15,000.
COMEX warehouse operators face the same constraints. When March arrives, and delivery notices demand 70-90+ million ounces, custodians cannot claim “we have adequate inventory” if a substantial portion is already earmarked, allocated, or subject to competing claims.
The January crash didn’t dissolve these encumbrances. It couldn’t. The physical metal remains physically committed. Only a flow of new unencumbered inventory—from mining, recycling, or strategic releases—could address this.
And that flow did not accelerate post-crash. If anything, physical silver accumulated by institutional investors (SLV, PSLV inflows totaling over 95 million ounces in H1 2025 alone, already exceeding 2024’s full-year total) further reduces available supply for COMEX delivery.
February’s Harbinger: What Continued Flows Signal
February 2026 data are still arriving, but early indicators matter. Daily warehouse reports, delivery notice issuance, and lease rate changes all track the marginal buyer.
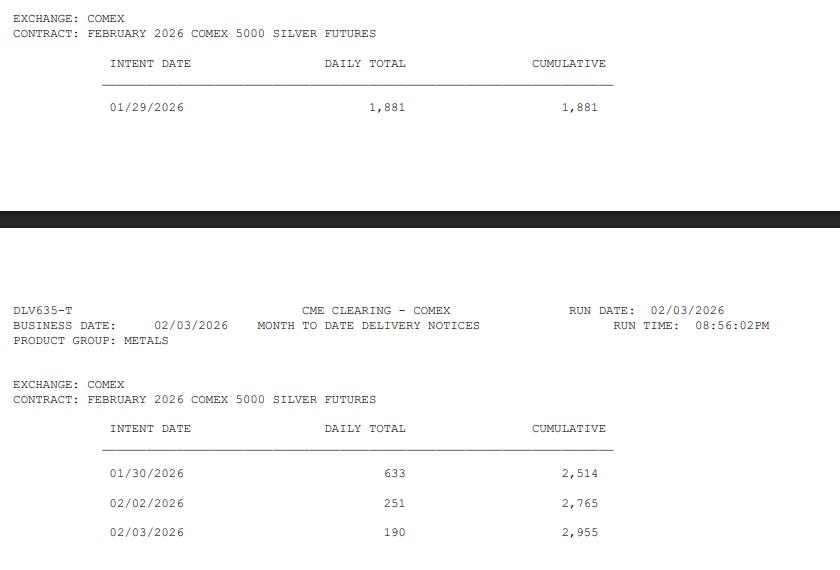
As of February 2, 2026, COMEX February silver contract deliveries show 251 contracts issued and stopped, with month-to-date deliveries reaching 2,765 contracts (approximately 13.8 million ounces). While significantly lower than January’s pace, this still represents material delivery demand in a non-major month.
If February shows continued delivery demand at elevated levels (2-4 million ounces per week), it signals that the structural demand for physical metal remains intact despite the price crash. This would indicate the crash was not a decisive event—merely a pause in the underlying migration.
If February shows stabilization with delivery demand dropping below 1 million ounces per week, it suggests the crash induced some margin-related pullback and that lenders are re-evaluating carry trade economics. This would be marginally positive for COMEX’s inventory position but would not resolve the March cliff.
Current indications (as of early February) suggest the first scenario: delivery demand continues at material levels relative to available registered inventory, albeit not at January peaks.
The Trade Implications: What Structural Weakness Tells You
For COMEX futures traders: Do not assume this crisis is over. The January crash purged leverage but not demand. Position sizing should reflect the fact that March remains a binary event with asymmetric outcomes. If you hold silver longs, maintain disciplined stops and risk management protocols. If you’re short, understand that any news of substantial registered inventory declines, elevated lease rates, or unexpected delivery demand will create violent upside reversals.
For physical accumulators: The crash provides a window. Physical silver under $90/oz represents a strategic accumulation opportunity if you can source it. Dealer premiums expanded post-crash (dealers raised markups as they faced inventory pressure and elevated replacement costs). But patient buyers can find opportunities. Once March passes and the market reprices structural risk, accumulation windows narrow.
Conclusion: The Trap Remains Sprung
The January 30 silver crash was not a resolution. It was a pressure relief valve for the most leveraged participants. The structural inventory trap remains intact. COMEX’s registered inventory, whether labeled at 103-113 million, 65 million, or substantially lower, depending on how you account for encumbrances, faces a March delivery month with demand that could easily exceed supply using conventional settlement methods.
The key observation: nothing about the crash reduced the volume of silver demanded in March. Nothing expanded the pool of unencumbered inventory. Nothing changed mining supply timelines (5-8 years for new production) or industrial demand (680.5 million ounces annually and rising). The crash changed leverage, sentiment, and positioning. It did not change the underlying mathematics.
For traders and institutional readers: treat March as a binary event with asymmetric payoffs. If COMEX delivers through conventional mechanisms, silver consolidates around current levels ($76-82 range), and the crisis narrative fades temporarily. If COMEX requires heavy intervention—emergency conversions, forced cash settlements, or regulatory accommodation—systemic stress spreads, and crisis premiums compound across asset classes.
The data is available. The mechanism is clear. The outcome will be visible within 30-45 days as March delivery notices arrive. Watch COMEX warehouse reports (updated daily at cmegroup.com), delivery notice issuance, and lease rate movements. They will signal which scenario unfolds. The price will follow the structure.
If you’d like to show your appreciation, you can support me through:
✨ Patreon
✨ Ko-fi
✨ BuyMeACoffee
Every contribution, big or small, fuels my creativity and means the world to me. Thank you for being a part of this journey!
It's interesting how you unravele this! Your analysis is so sharp, makes me think of finally nailing a tricky Pilates transition. Super insightful, really appreciate the clarity!