Understanding the CFTC COT Report: A Modern Trader's Guide to Gold Futures Intelligence
Commitment of Traders (COT) report
Thank you so much for your support—I truly appreciate you choosing to back my work. To ensure I maintain quality and balance, I’ll be posting a little less often moving forward, but rest assured, this Substack isn’t going anywhere. A special shout‑out to my two paid subscribers—your support means more than words can say.
Introduction: The Key Tool for Gauging Market Pulse
The Commitments of Traders (COT) report is one of the rare public datasets that lets retail traders see how major market participants are positioned. Published weekly by the CFTC, the disaggregated COT shows who’s long, who’s short, and — most importantly — how different trader classes behave. When combined with technical confirmation, COT extremes and cross-category divergences offer a durable strategic bias that price charts alone cannot provide.
This guide explains how to turn raw COT data into a repeatable trading edge: how to compute COT indices, interpret extremes and divergences, integrate timing with technicals, and avoid common traps.
The Foundation: What Makes COT Reports Essential
For decades, successful traders have relied on a simple yet profound principle: follow the smart money. The COT report delivers exactly that intelligence, breaking down who holds what positions in the gold futures market with surgical precision. Unlike price charts that show you what happened, COT data reveals who made it happen and where they're positioned for what comes next.
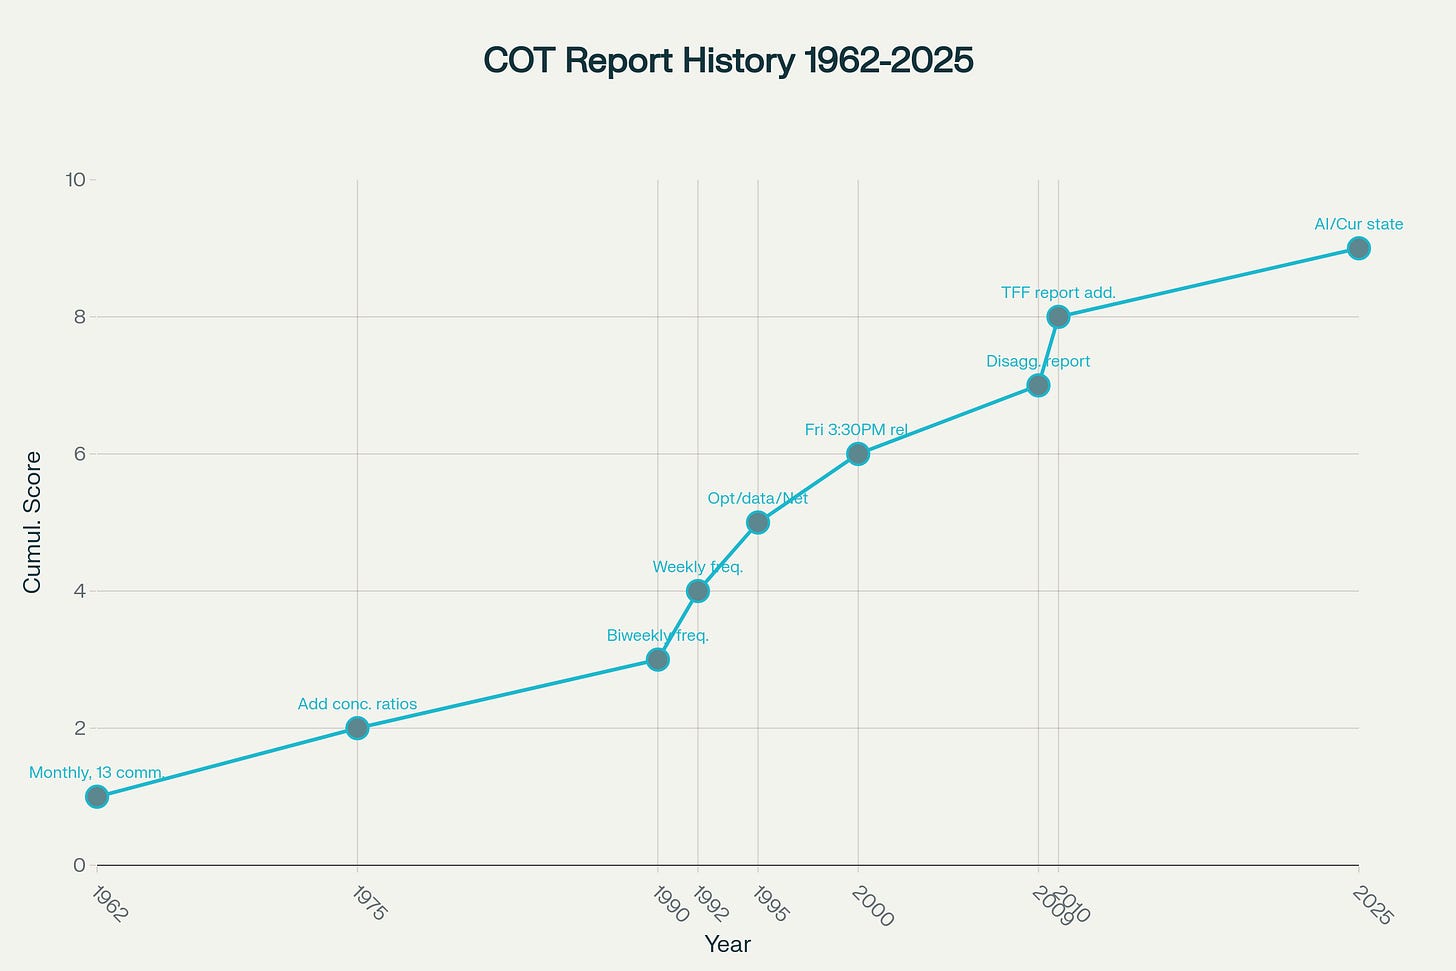
The CFTC, established in 1974, transformed from a small agricultural regulator into the guardian of the world's most sophisticated derivatives markets. This evolution mirrors the journey of the COT report itself – from a simple monthly newsletter covering 13 agricultural commodities to today's comprehensive weekly intelligence briefing that covers precious metals, energies, currencies, and financial instruments.
The Evolution: From Agricultural Origins to Financial Intelligence
The transformation of the COT report represents one of the most significant advances in market transparency over the past six decades. What began as basic agricultural position data has evolved into sophisticated multi-dimensional market intelligence that incorporates options data, concentration ratios, and disaggregated trader classifications.
The most significant breakthrough came in 2009 with the introduction of disaggregated reporting. This wasn't merely an incremental improvement – it was a complete reimagining of how we understand market participation. The old binary classification of "commercial" versus "non-commercial" traders had become obsolete in an era where index funds, swap dealers, and algorithmic trading strategies dominated market flows.
Decoding the New Framework: Four Categories That Matter
Let's be brutally honest: most gold traders are flying blind. They're watching price charts, drawing trend lines, and setting RSI alerts while completely ignoring the massive positioning data that moves markets. It's like trying to predict traffic flow by staring at one car instead of checking the highway traffic report.
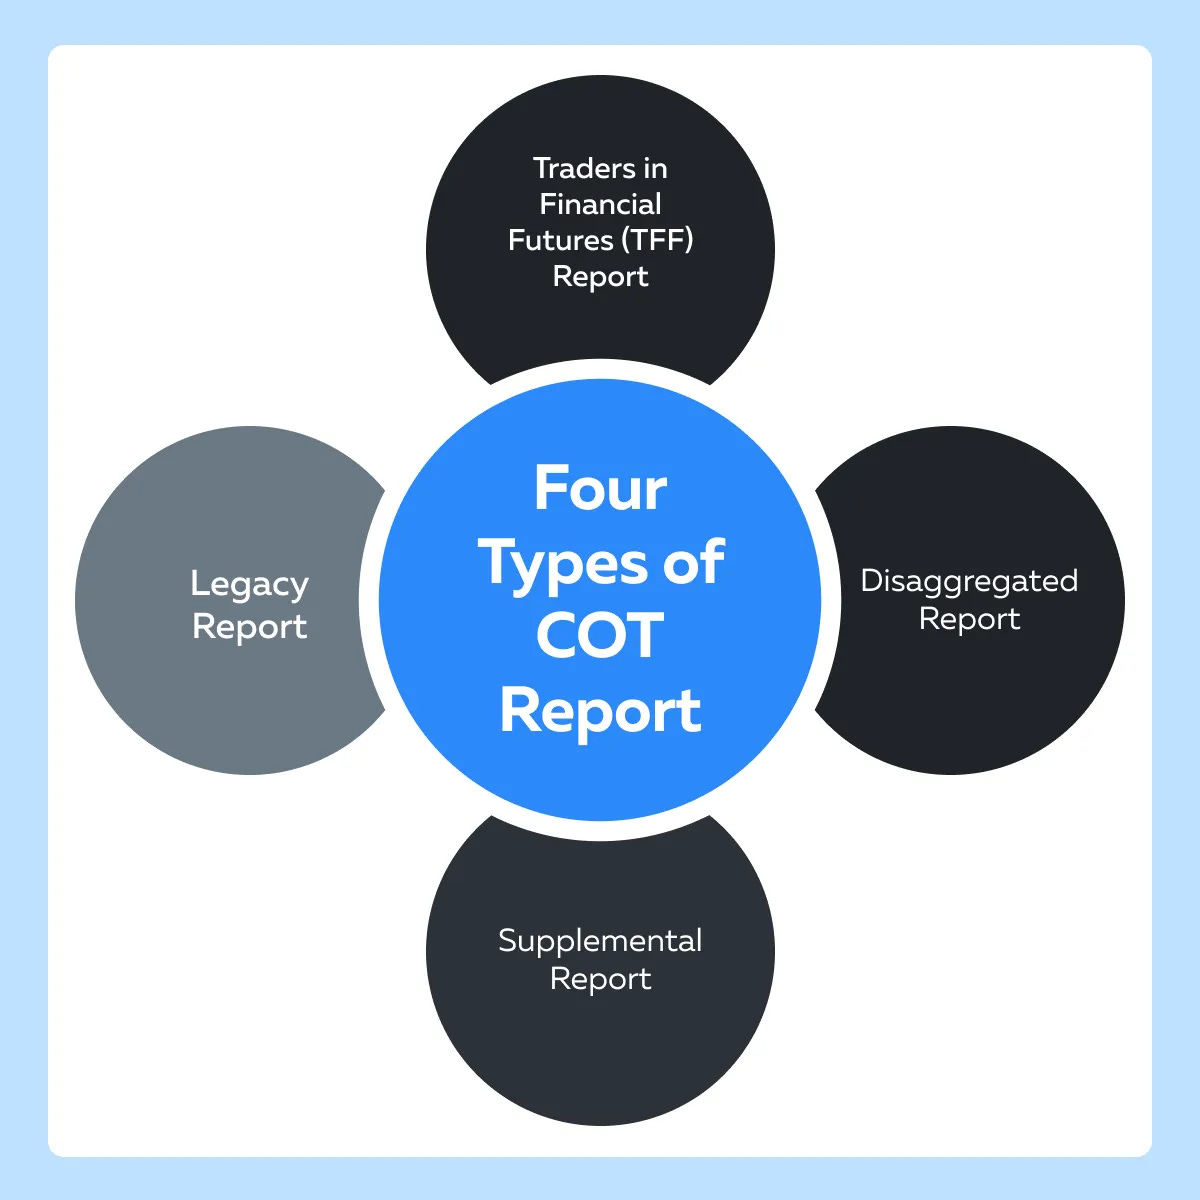
The disaggregated COT report revolutionized market analysis by creating four distinct trader categories, each with unique motivations and behavioral patterns:
1. Producer/Merchant/Processor/User: The Smart Money Hedgers
Think of this group as gold's natural short sellers – mining companies locking in future production prices, jewelry manufacturers securing input costs, and refiners managing inventory risk. These aren't speculators; they're business operators with intimate knowledge of physical gold supply and demand fundamentals.
Key behavioral insight: When producers aggressively increase their short positions, they're essentially telling you they view current prices as attractive selling opportunities for their future production. Conversely, when they reduce shorts or (rarely) go net long, they're signaling that prices may be too low relative to production costs and market fundamentals.
2. Swap Dealers: The Hidden Institutional Flow
This is where most traders get confused. Swap dealers aren't expressing market views – they're hedging risk from over-the-counter transactions with institutional clients. When you see massive swap dealer short positions, it often reflects institutional buying of gold ETFs and commodity index products that dealers must hedge in futures markets.
The critical insight: Growing swap dealer short positions frequently signal increasing institutional demand for gold exposure through ETFs and structured products. It's not bearish positioning – it's actually a proxy for institutional gold investment demand.
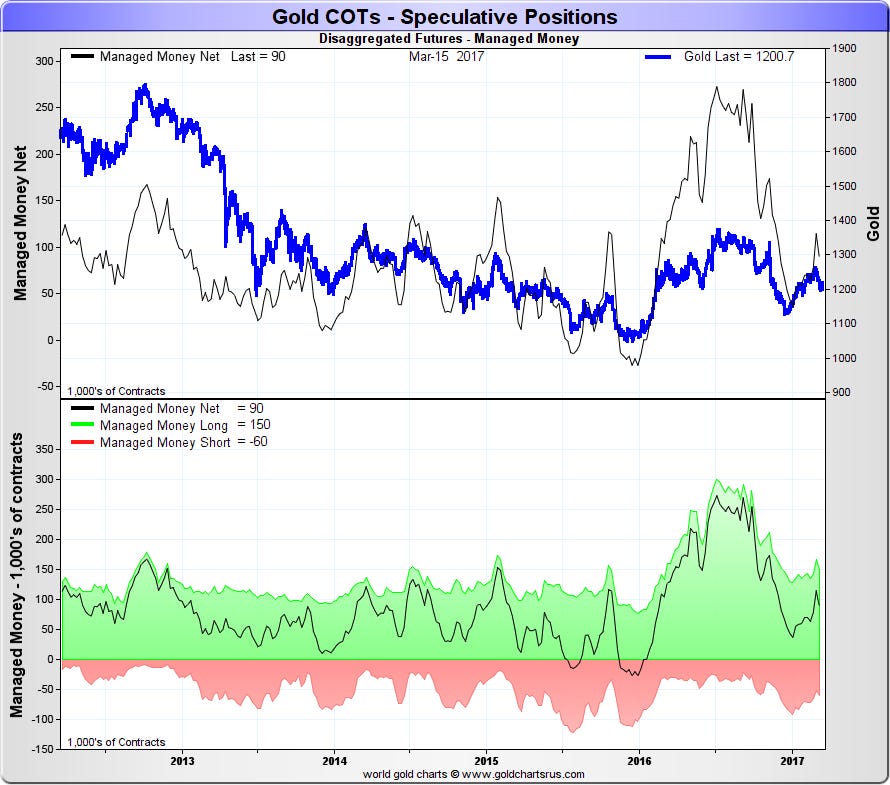
3. Managed Money: The Trend-Following Speculators
These are the CTAs, hedge funds, and professional money managers – the quintessential momentum players. They follow trends, pile into winning trades, and often reach extreme positioning at major market turning points.
Behavioral pattern recognition: Managed money positioning is powerfully predictive when it reaches historical extremes. Record net long positions often precede significant corrections, while extreme short positions frequently mark major bottoms.
4. Other Reportables: The Wildcard Players
This catch-all category includes large individual traders, corporate treasuries, and institutional investors who don't fit the other classifications. While harder to interpret due to mixed motivations, their positioning can provide valuable confirmation signals when analyzed alongside other categories.
The Art of Reading Market Extremes: When Positioning Becomes Predictive
Here's where COT analysis transforms from interesting data to actionable intelligence. The magic happens at positioning extremes – those moments when trader categories reach historical positioning levels that have historically preceded major trend changes.
Quantifying Extremes: The COT Index Method
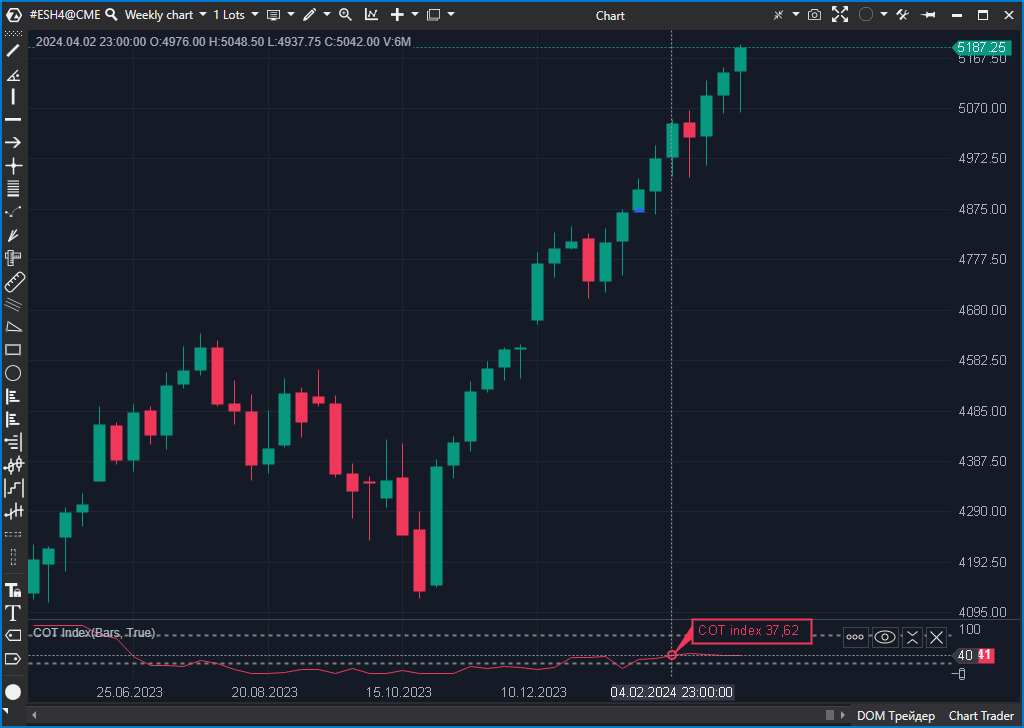
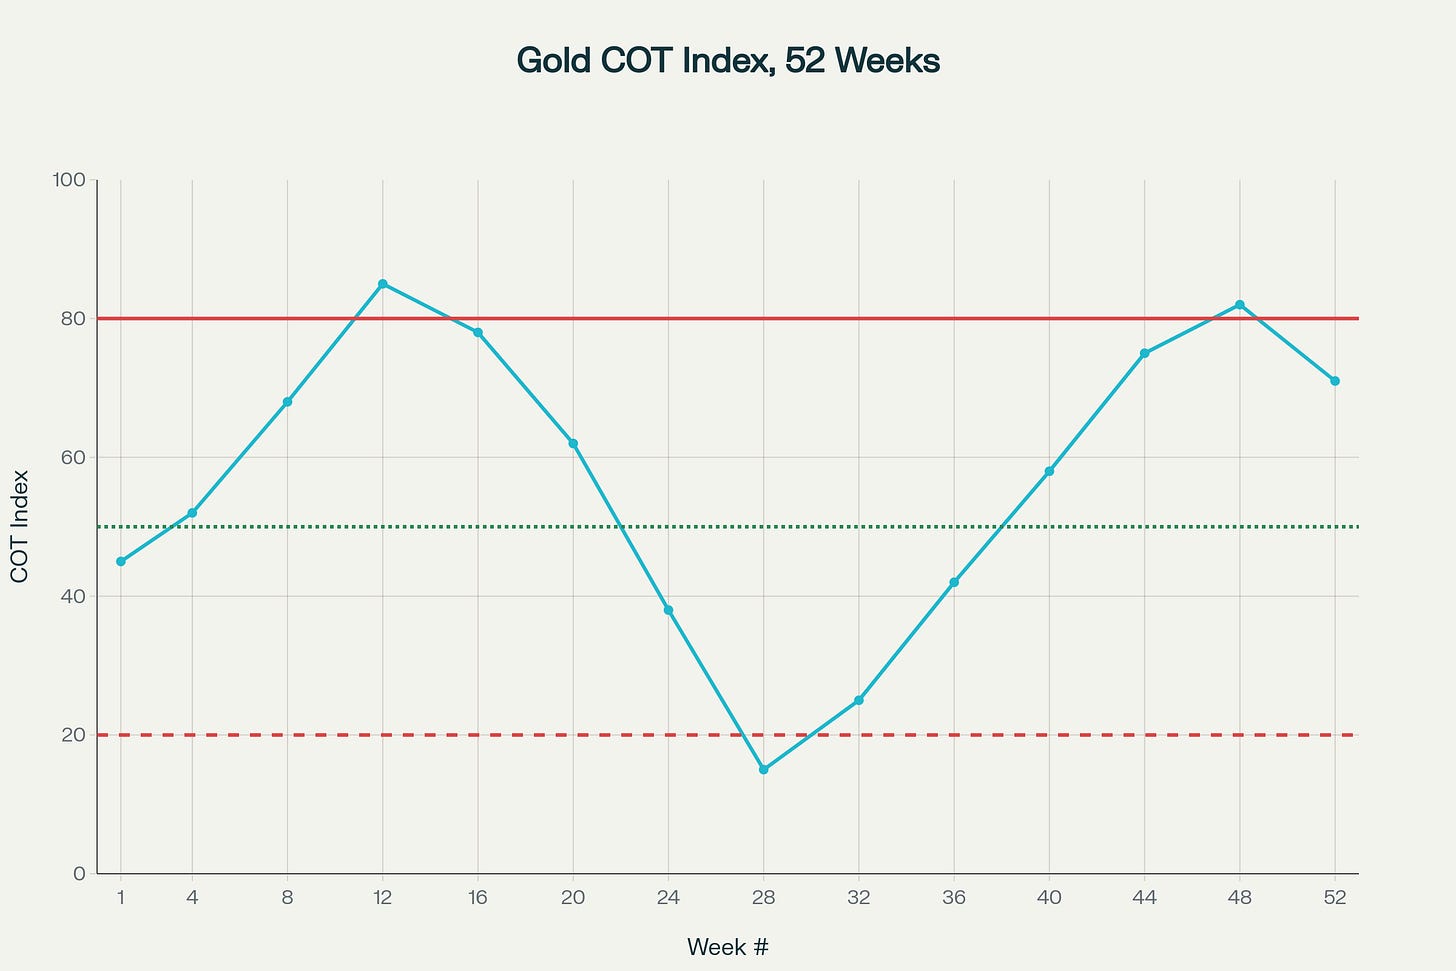
COT Index Oscillator: Identifying Market Sentiment Extremes in Gold Futures (Annual Cycle)
The most effective way to identify extremes is through the COT Index, which transforms raw positioning data into a 0-100 oscillator:
COT Index = 100 × (Current Net Position - Minimum Net Position over Lookback Period) / (Maximum Net Position - Minimum Net Position over Lookback Period)
This formula creates clear extreme readings:
90-100: Historical extreme bullish positioning
0-10: Historical extreme bearish positioning
40-60: Neutral positioning range
Unlike traditional technical indicators that rely solely on price action, the COT Index reflects actual capital allocation decisions by sophisticated market participants. When managed money reaches extreme long positions (COT Index above 90), it doesn't necessarily mean gold will fall immediately. Instead, it suggests that the fuel for continued upward movement may be diminishing as fewer institutional buyers remain on the sidelines.
The contrarian application works best during trending markets where positioning becomes increasingly one-sided. During consolidation phases, COT extremes may persist longer as institutional players maintain strategic positions while waiting for fundamental catalysts.
The Z-Score Alternative
For statistically-minded traders, Z-scores provide another robust method for identifying extremes. A Z-score above +2.0 (two standard deviations above the mean) signals extreme bullish positioning, while readings below -2.0 indicate extreme bearish positioning.
Decoding the Market's Most Powerful Reversal Signal
The holy grail of COT analysis occurs when "smart money" (producers/commercials) and "hot money" (managed money speculators) reach opposite extremes simultaneously. This divergence has historically preceded some of gold's most significant trend reversals.
Classic Market Top Setup
The Perfect Storm Configuration:
Managed Money: COT Index > 90 (extreme net long)
Producers: COT Index < 10 (extreme net short)
Price action: Extended uptrend with momentum indicators showing divergence
Confirmation: Technical breakdown below key support levels
Market Psychology: Speculators are "all in" on the bullish side while producers find prices so attractive they're hedging aggressively. This setup suggests speculative excess and impending supply pressure from producers.
Classic Market Bottom Reversal
The Capitulation Configuration:
Managed Money: COT Index < 10 (extreme net short or minimal net long)
Producers: Unusually low short positioning or rare net long (COT Index > 90)
Price action: Oversold conditions with panic selling
Confirmation: Technical reversal patterns and positive divergences
The Psychology: Speculators have capitulated while producers see values too attractive to hedge against, removing selling pressure and setting up for supply-driven rallies.
Keep reading with a 7-day free trial
Subscribe to Market Architect - Gold, Stock Market, Money to keep reading this post and get 7 days of free access to the full post archives.


